Full statement of net position
| ASSETS | ||||
| Current Assets | FY2024 | FY2023 | FY2022 | FY2021 |
| Cash | 239 | 532 | 738 | 921 |
| Short-Term Investments | 475 | 938 | 1,420 | 704 |
| Investments Held By Trustees | 3 | 95 | 162 | 104 |
| Accounts Receivable | 1,639 | 981 | 820 | 748 |
| Pledges Receivable | 3 | 3 | 2 | 1 |
| Current Portion of Notes & Mortgages Receivable | 5 | 6 | 6 | 7 |
| Inventories | 81 | 68 | 64 | 53 |
| Other Current Assets | 101 | 88 | 88 | 84 |
| Total Current Assets | 2,545 | 2,710 | 3,300 | 2,621 |
| Noncurrent Assets | ||||
| Investments | 2,568 | 2,667 | 2,428 | 2,773 |
| Investments Held By Trustees | 86 | 50 | 72 | 306 |
| Pledges Receivable | 0 | 0 | 1 | 1 |
| Notes & mortgages receivable | 129 | 122 | 139 | 149 |
| Capital Assets, Net | 6,587 | 5,767 | 5,321 | 4,369 |
| Other Noncurrent Assets | 170 | 186 | 149 | 34 |
| Total Noncurrent Assets | 9,539 | 8,792 | 8,164 | 7,632 |
| Total Assets | 12,084 | 11,502 | 11,464 | 10,253 |
| DEFERRED OUTFLOWS OF RESOURCES | ||||
| Deferred Outflow of Resources | FY2024 | FY2023 | FY2022 | FY2021 |
| Deferred Outflows Debt Refunding and Deferred Financing | 7 | 7 | 7 | 8 |
| Deferred Outflows from Pension | 448 | 534 | 987 | 557 |
| Deferred Outflows from Retiree Health | 626 | 840 | 881 | 1,003 |
| Deferred Outflows from Assets Retirement Obligations | 5 | 18 | 32 | 17 |
| Total Deferred Outflows of Resources | 1,086 | 1,399 | 1,907 | 1,585 |
| LIABILITIES | ||||
| Current Liabilities | FY2024 | FY2023 | FY2022 | FY2021 |
| Accounts Payable | 440 | 387 | 382 | 283 |
| Accrued Salaries and Benefits | 149 | 224 | 179 | 177 |
| Unearned Revenue | 781 | 327 | 305 | 253 |
| Commercial Paper | 127 | 28 | 40 | 50 |
| Current Portion of Long-Term Debt | 182 | 142 | 121 | 78 |
| Other Current Liabilities | 182 | 197 | 176 | 498 |
| Total Current Liabilities | 1,861 | 1,304 | 1203 | 1,338 |
| Noncurrent Liabilities | ||||
| Federal Refundable Loans | 41 | 21 | 37 | 42 |
| Long-Term Debt | 4,264 | 4,253 | 4,451 | 3,228 |
| Net Pension Liability (Obligations to UCRP) | 2,687 | 3,096 | 3,178 | 1,024 |
| Payable to UCOP for Pension | 1,100 | 1,048 | 969 | 790 |
| Net Obligations for Retiree Health Benefits | 3,073 | 3,368 | 3,037 | 3,715 |
| Other Noncurrent Liabilities | 262 | 220 | 290 | 246 |
| Total Noncurrent Liabilities | 11,427 | 12,008 | 11,963 | 9,045 |
| Total Liabilities | 13,288 | 13,312 | 13,166 | 10,383 |
| DEFERRED INFLOWS OF RESOURCES | ||||
| Deferred Inflow of Resources | FY2024 | FY2023 | FY2022 | FY2021 |
| Deferred Inflows Svc Concession Arngmts | 43 | 43 | 44 | 45 |
| Deferred Inflows-Pension | 437 | 62 | 75 | 1,571 |
| Deferred Inflows from Retiree Health | 1,477 | 1,367 | 1,650 | 983 |
| Deferred Inflows from Interest Rate Swap Agreements | 1 | 1 | - | - |
| Deferred Inflows from Leases | 72 | 125 | 96 | - |
| Total Deferred Inflows of Resources | 2,030 | 1,598 | 1,866 | 2,599 |
| NET ASSETS | ||||
| Net Investment in Capital Assets | 2,528 | 1,755 | 741 | 1,099 |
| Restricted | ||||
| Nonexpendable | 138 | 138 | 136 | 133 |
| Expendable | 1,442 | 1,688 | 2,505 | 1,343 |
| Total Restricted | 1,580 | 1,825 | 2,642 | 1,476 |
| Unrestricted | (6,256) | (5,589) | (5,044) | (3,718) |
| Total Net Assets | (2,148) | (2,008) | (1,662) | (1,143) |
Understanding the Statement of Net Position
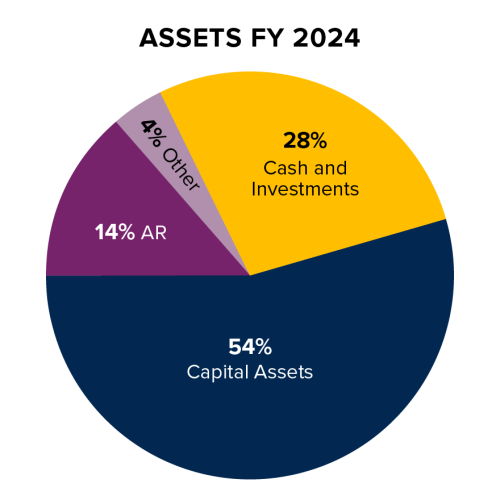
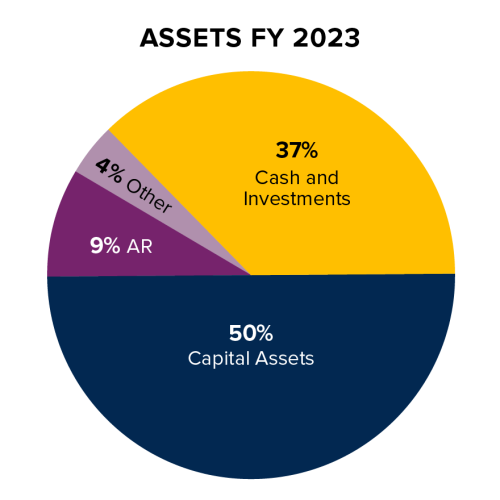
ASSETS AND DEFERRED OUTFLOWS OF RESOURCES
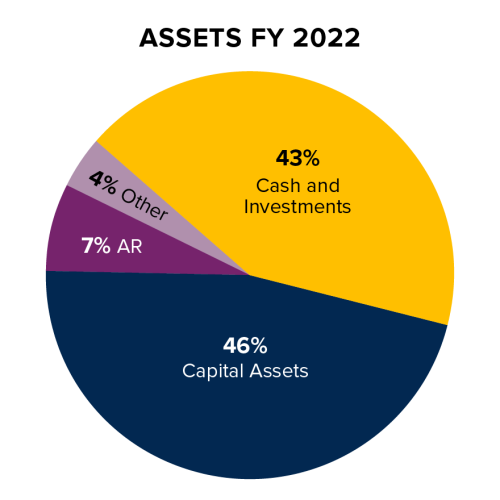
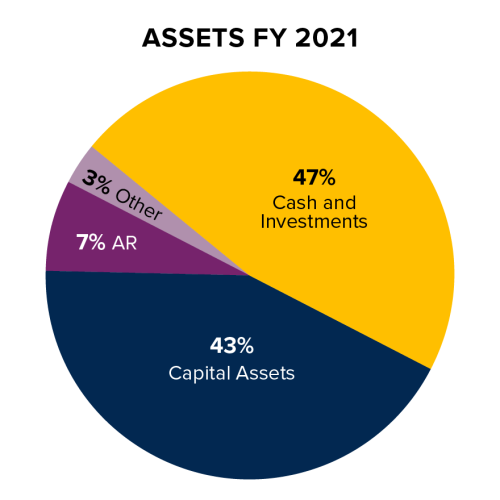
UC Davis' assets consists of cash and investments, accounts receivable, and capital assets. Deferred outflow of resources is comprised of asset retirement obligations, losses on debt refundings, and changes in net pension liability and net retiree health benefits liability.
Total assets and deferred outflow of resources were $13.2 billion in FY2024, $12.9 billion in FY2023 and $13.4 billion in FY2022.
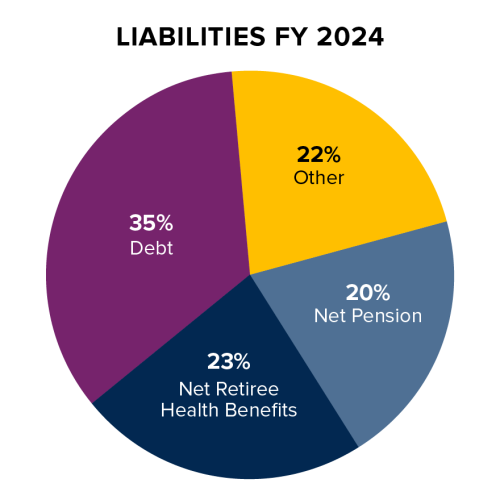
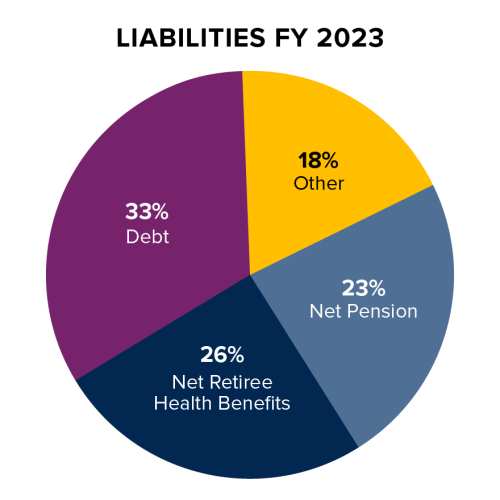
LIABILITIES AND DEFERRED INFLOWS OF RESOURCES
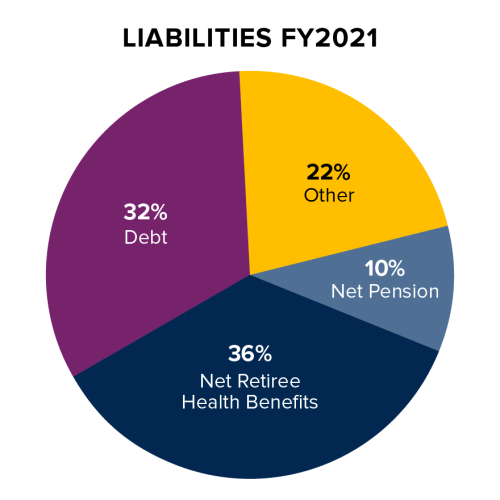
UC Davis' liabilities consists of accounts payable, accrued compensation, debt, pension liability and retiree health benefits liability. Deferred inflow of resources is comprised of gains on debt refundings, changes in net pension liability and net retiree health benefits liability, service concession agreements and leases.
Total liabilities and deferred inflows of resources were $15.3 billion in FY2024, $14.9 billion in FY2023 and $15.0 billion in FY2022.
Condensed statement of net position
The Statement of Net Position (SNP) shows UC Davis' total assets, deferred outflow of resources, liabilities, and deferred inflows of resources. The net position is calculated by taking the difference between the total of assets and deferred outflows of resources and the total liabilities and deferred inflows of resources. The statement provides insight into the financial position of UC Davis, including UC Davis campus and UC Davis Medical Center.
The balances presented below are as of June 30 for fiscal years 2021 through 2024.
Condensed Statement of Net Position
| (in millions of dollars) | FY 2024 | FY 2023 | FY 2022 | FY 2021 |
|---|---|---|---|---|
| ASSETS | ||||
| Cash and investments | 3,369 | 4,281 | 4,874 | 4,807 |
| Accounts receivable, net | 1,639 | 981 | 820 | 748 |
| Capital assets, net | 6,587 | 5,767 | 5,321 | 4,369 |
| Other assets | 488 | 472 | 449 | 329 |
| Total | 12,084 | 11,502 | 11,464 | 10,253 |
| DEFERRED OUTFLOW OF RESOURCES | 1,086 | 1,399 | 1,907 | 1,585 |
| LIABILITIES | ||||
| Debt, including commercial paper | 4,572 | 4,424 | 4,613 | 3,356 |
| Net pension liability | 2,687 | 3,096 | 3,178 | 1,024 |
| Net retiree benefits liability | 3,073 | 3,368 | 3,037 | 3,715 |
| Other liabilities | 2,955 | 2,424 | 2,339 | 2,288 |
| Total | 13,288 | 13,312 | 13,166 | 10,383 |
| DEFERRED INFLOWS OF RESOURCES | 2,030 | 1,598 | 1,866 | 2,599 |
| NET POSITION | (2,148) | (2,008) | (1,662) | (1,143) |
NOTE: The reported financial information in this report, while not separately audited, is prepared from the official University of California records and accounts which are maintained in accordance with the Governmental Accounting Standards Board (GASB). For more information, please refer to the University of California's Annual Report.
- FY2024
-
- FY2023
-
- FY2022
-

- FY2021
-
Cash
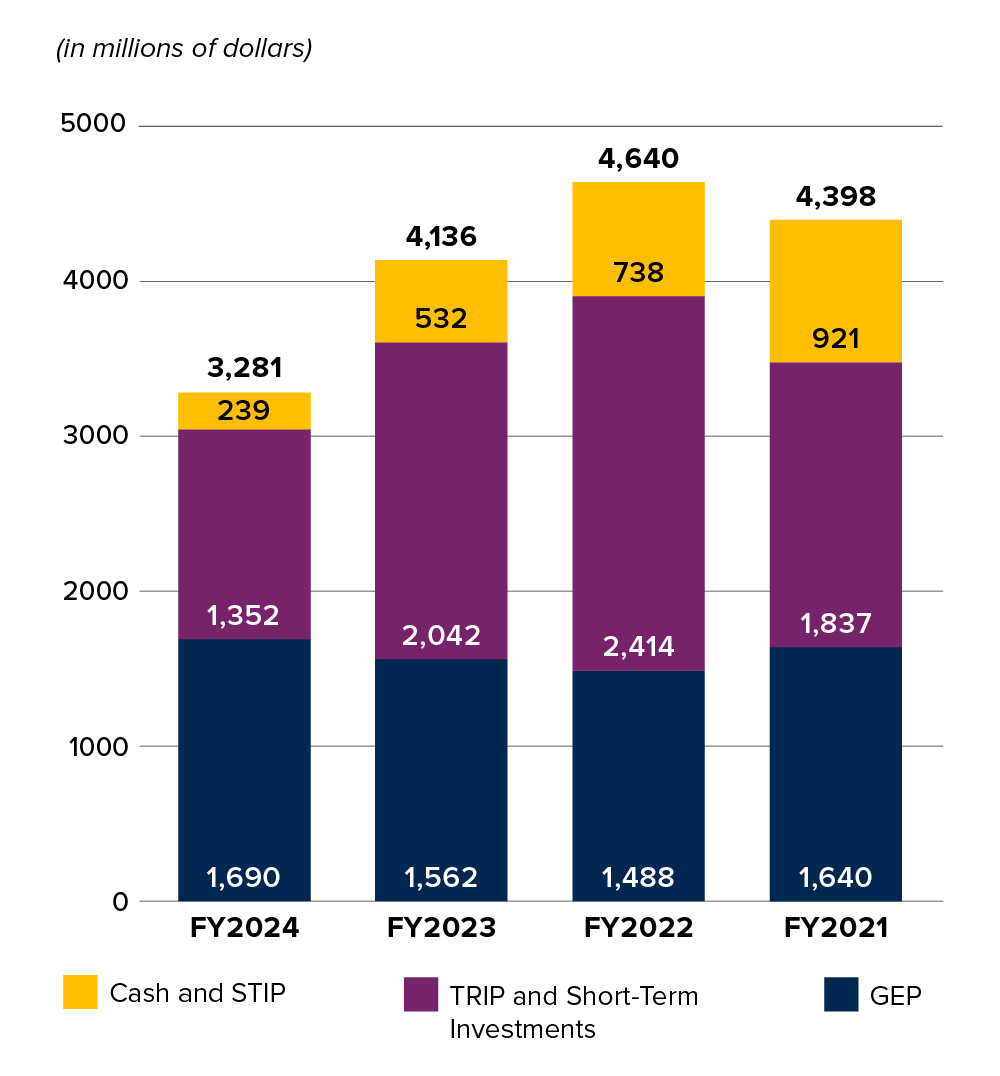
UC Davis' cash and investments are centrally managed by the University's Office of the Chief Investment Officer.
STIP is the short-term investment pool, allowing for UC Davis to maximize its returns on its short-term cash balances. Cash to provide for payroll, construction expenditures, and other operating expenses is invested in STIP. STIP had returns of 4.2% in 2024, 2.8% in 2023 and 0.4% in 2022.
TRIP is the total return investment pool, allowing UC Davis the opportunity to maximize the return on its long-term working capital. TRIP is a diversified portfolio of equity, fixed income, and alternative investments. TRIP had returns of 12.1%, 8.6% and (11.3)% in 2024, 2023 and 2022, respectively.
Short-term investment includes cash held for capital projects. These unallocated bond proceeds decreased $482M in FY23 and $463M in FY24 as construction activities continued to progress.
GEP is the general endowment pool, a balanced investment portfolio and the primary investment vehicle for endowed gift funds. GEP had returns of 11.7%, 8.2% and (7.6)% in 2022, 2023 and 2022, respectively.
For more information regarding investments, please visit the UC Investments website.
| FY 2024 | FY 2023 | FY 2022 | FY 2021 | |
|---|---|---|---|---|
| Cash and STIP | 239 | 532 | 738 | 921 |
| TRIP and Short-Term Investments | 1,352 | 2,042 | 2,414 | 1,837 |
| GEP | 1,690 | 1,562 | 1,488 | 1,640 |
| Total | 3,281 | 4,136 | 4,640 | 4,398 |
Capital assets
UC Davis implemented a new accounting standard, Government Accounting Standard Board Statement No. 87, Leases (GASB 87), effective for the University's fiscal year beginning July 1, 2021. This accounting standard provides recognition and measurement standards for financings of the right to use an underlying asset. Similarly, UC Davis also implemented new accounting standard, Government Accounting Standard Board Statement No. 96, Subscription-Based Information Technology Arrangements (GASB 96), effective for the University's fiscal year beginning July 1, 2022. Under GASB 96, these arrangements result in a right-to-use intangible asset and a corresponding subscription liability. Financial information has been restated to retroactively apply these new accounting standards.
In FY2024, UC Davis has been investing its resources in constructing affordable housing to meet student enrollment increases. Orchard Park opened its doors for the 2023-24 academic year with 1,500 new beds.
Construction also continued at AggieSquare in Sacramento, which will feature state-of-the-art research facilities and modern office and mixed-use space that will connect the university with its neighboring communities.
Other capital projects include enhancing campus safety through investments in upgrading outdoor lighting and building access controls, and the groundbreaking of the UC Davis Health California Tower.
Net capital asset balances were $6.6 billion, $5.8 billion and $5.3 billion as of June 30th for fiscal years FY2024, FY2023, and FY2022 respectively.
For more information on current and on-going capital projects, please refer to the following websites:
UC Davis Campus Design and Construction Management
UC Davis Health Facilities Design and Construction
- FY 2024
Asset Type Additions Depreciation & Amortization Disposals & Impairments Capital Assets, Net Land 1 - - 137 Infrastructure 3 (11) - 167 Buildings & Improvements 907 (170) 16 3,535 Equipment 81 (119) 13 366 Software and Intangible Assets 29 (11) 5 60 Leases (GASB87) 35 (44) (19) 397 Subscription-Based IT Agreements (GASB96) 53 (20) - 48 Libraries and Special Collections 13 (15) (4) 199 Construction in Progress 77 - 1,678 Total 1,199 (390) 11 6,587 - FY 2023
Asset Type Additions Depreciation & Amortization Disposals & Impairments Capital Assets, Net Land 18 136 Infrastructure 77 (9) - 175 Buildings & Improvements 215 (171) 2 2,782 Equipment 121 (79) (4) 391 Software and Intangible Assets 5 (11) 8 37 Leases (GASB87) 49 (44) (17) 425 Subscription-Based IT Agreements (GASB96) 31 (16) - 15 Libraries and Special Collections 22 (16) (1) 205 Construction in Progress 266 1,601 Total 804 (346) (12) 5,767 - FY 2022
Asset Type Additions Depreciation & Amortization Disposals & Impairments Capital Assets, Net Land 40 118 Infrastructure 8 (8) (1) 107 Buildings & Improvements 374 (154) 54 2,736 Equipment 100 (75) (33) 353 Software and Intangible Assets 17 (11) (9) 35 Leases (GASB87) 471 (34) 437 Subscription-Based IT Agreements (GASB96) - - Libraries and Special Collections 15 (16) - 200 Construction in Progress 214 1,335 Total 1,239 (298) 11 5,321 - FY 2021
Asset Type Additions Depreciation & Amortization Disposals & Impairments Capital Assets, Net Land 1 - - 78 Infrastructure 12 (8) - 108 Buildings & Improvements 221 (152) (25) 2,462 Equipment 100 (76) (6) 361 Software and Intangible Assets 2 (14) (2) 38 Leases (GASB87) - Subscription-Based IT Agreements (GASB96) - Libraries and Special Collections 21 (16) 2 201 Construction in Progress 335 1,121 Total 692 (266) (31) 4,369
Debt
The University of California (the University) directly finances the construction, renovation, and acquisition of facilities and equipment, or for other purposes, through the issuance of debt obligations, or indirectly, through structures that involve legally separate entities reported as blended component units.
Commercial paper and bank loans provide interim financing for assets during construction period.
Long-term financing includes revenue bonds, capital lease obligations and other borrowings.
Recent Highlights:
- In FY2019 added 3rd party investment of CHF I and in 2021 added CHF II
- In 2022 added MCPR 2022P of $570M and 2022Q of $210M
- In 2022 adopted GASB87 of $474M and In 2023 adopted GASB96
- Beginning in 2022 and continuing through 2024 introduced the Central Bank loan
For more information regarding outstanding debt held by the University of California, please refer to the University's Bond Programs website.
| Debt | Debt Type | Interest Rate Range | Maturity Years | FY24 Balance | FY23 Balance | FY22 Balance | FY21 Balance |
|---|---|---|---|---|---|---|---|
| Revenue Bonds | General Revenue Bonds - Fixed Rate | 0.7-7.6% | 2025-2115 | 720 | 743 | 1,128 | 1,159 |
| General Revenue Bonds - Variable Rate | 4.6-5.4% | 2025-2048 | 89 | 89 | 89 | 89 | |
| Limited Project Revenue Bonds | 1-5.5% | 2025-2058 | 316 | 328 | 363 | 383 | |
| Medical Center Pooled Revenue Bonds | 2.4-6.6% | 2025-2120 | 1,355 | 1,373 | 1,396 | 635 | |
| Unamortized Bond Premium | 196 | 212 | 160 | 154 | |||
| Total Revenue Bonds | 2,676 | 2,745 | 3,136 | 2,420 | |||
| Other Debt | Financing Obligations | Various | 2025-2090 | 451 | 465 | 474 | 0 |
| Subscription-based information technology arrangements | Various | 2025-2031 | 37 | 14 | 0 | 0 | |
| Central Bank Loan and other University Borrowings | Various | 2025-2054 | 502 | 384 | 95 | 15 | |
| Blended component unit revenue bonds, net | 3-6.5% | 2051-2054 | 779 | 789 | 867 | 872 | |
| Total Debt Obligations | 4,445 | 4,397 | 4,572 | 3,307 | |||
| Less Amount Due Within One Year | (182) | (142) | (121) | (78) | |||
| Noncurrent Portion of Debt | 4,263 | 4,255 | 4,451 | 3,229 |
Pension
All full-time employees of UC Davis participate in the University of California Retirement System (UCRS) that is centrally administered by the University of California (the University). The UCRS consists of the University of California Retirement Plan (UCRP) and the University of California Retirement Savings Program (UCRSP). UCRP is a single-employer defined benefit pension plan and UCRSP includes four contribution plans with several investment portfolios which are generally funded with employee non-elective and elective contributions.
The Regents of the University of California acts as the trustee associated with the UCRP plan. The Office of the Chief Investment Officer (OCIO) acts as the custodian for the UCRS plan. Administrative authority with respect to the UCRS Plans is vested in the President of the University (President) as plan administrator and the President has delegated that authority within UCRS, under University policies and procedures, to the Vice President of Human Resources.
Additional information on the retirement plans can be obtained from the Retirement System Annual Reports website.
UCRP Contributions

| UCRP Contributions | FY 2024 | FY 2023 | FY 2022 | FY 2021 |
|---|---|---|---|---|
| Proportion of the University's Net Pension Liability | 15.6% | 15.8% | 15.8% | 15.4% |
| Proportionate Share of the University's Net Pension Liability | 2,686,775 | 3,096,019 | 3,177,587 | 1,023,544 |
Pension Actuarial Assumptions
| FY2024 | FY2023 | FY2022 | FY2021 | |
|---|---|---|---|---|
| Cost-of-living adjustments | 2.00% | 2.00% | 2.00% | 2.00% |
| Discount rate | 6.75% | 6.75% | 6.75% | 6.75% |
| Inflation | 2.50% | 2.50% | 2.50% | 2.50% |
| Investment rate of return | 6.75% | 6.75% | 6.75% | 6.75% |
| Projected salary increases | 3.65-5.95% | 3.65-5.95% | 3.65-5.95% | 3.65-5.95% |
Sensitivity of the Net Pension Liability to the Discount Rate Assumptions
| Sensitivity Rate | Net Pension Liability | ||
|---|---|---|---|
| FY2024 | 1% Decrease | 5.75% | 4,983 |
| Current Discount | 6.75% | 2,687 | |
| 1% Increase | 7.75% | 806 | |
| FY2023 | 1% Decrease | 5.75% | 5,253 |
| Current Discount | 6.75% | 3,096 | |
| 1% Increase | 7.75% | 1,330 | |
| FY2022 | 1% Decrease | 5.75% | 5,205 |
| Current Discount | 6.75% | 3,178 | |
| 1% Increase | 7.75% | 1,523 | |
| FY2021 | 1% Decrease | 5.75% | 2,900 |
| Current Discount | 6.75% | 1,024 | |
| 1% Increase | 7.75% | (517) | |
Retiree health
The University of California (The University) administers single-employer health and welfare plans to provide health and welfare benefits, primarily medical, dental, and vision benefits, to eligible retirees and their eligible family members of the University of California and its affiliates. The University funds the retiree health benefits through the University of California Retiree Health Benefit Trust (UCRHBT) based on a projection of benefits on pay-as-you-go financing. UCRHBT was established on July 1, 2007 and allows UC Davis to fund retiree health benefits along with other UC campuses and medical centers on a cost-sharing basis and accumulate funds under an arrangement segregated from the University's assets.
The University acts as a third-party administrative agent on behalf of UCRHBT to pay health care insurers and administrators amounts currently due. The Regents of the University of California have the authority to establish and amend benefit plans.
Retiree Health Benefit Costs and Obligations

Sensitivity of Net Retiree Health Liability to the Discount Rate Assumption All
(in millions of dollars)
| Sensitivity Rate | Net Pension Liability | ||
|---|---|---|---|
| FY2024 | 1% Decrease | 2.65% | 3,601 |
| Current Discount | 3.65% | 3,073 | |
| 1% Increase | 4.65% | 2,648 | |
| FY2023 | 1% Decrease | 2.54% | 3,972 |
| Current Discount | 3.54% | 3,368 | |
| 1% Increase | 4.54% | 2,884 | |
| FY2022 | 1% Decrease | 1.16% | 3,600 |
| Current Discount | 2.16% | 3,037 | |
| 1% Increase | 3.16% | 2,590 | |
| FY2021 | 1% Decrease | 1.21% | 4,489 |
| Current Discount | 2.21% | 3,715 | |
| 1% Increase | 3.21% | 3,110 | |
Actuarial Assumptions All
| FY 2024 | FY 2023 | FY 2022 | FY 2021 | |
|---|---|---|---|---|
| Discount Rate | 3.65% | 3.54% | 2.16% | 2.21% |
| Inflation | 2.50% | 2.50% | 2.50% | 2.50% |
| Investment rate of return | 2.50% | 2.50% | 2.50% | 2.50% |
| Health care cost trend rates | Initially ranges from -3.06% to 29.06% decreasing to an ultimate rate of 3.94% for 2075 and later years | Initially ranges from 1.35% to 14.55% decreasing to an ultimate rate of 3.94% for 2075 and later years | Initially ranges from 2.7% to 7.5% decreasing to an ultimate rate of 4.04% for 2075 and later years | Initially ranges from 2.7% to 9.0% decreasing to an ultimate rate of 4.04% for 2076 and later years |
Endowment
Endowment funds are held and administered by either the University of California (the University) or by the campus foundations. The amounts reflected on this page are those administered by the University.
The University's endowment income distribution policies are designed to preserve the value of the endowment in real terms (after inflation) and to generate a predictable stream of spendable income. Endowment investments are managed to achieve the maximum long-term total return. As a result of this emphasis on total return, the proportion of annual income distribution provided by investment income may vary from year-to-year. The University's policy is to retain the realized and unrealized appreciation with the endowment after the annual income distribution has been made.
The portion of the investment returns earned on endowments held by the University and distributed each year to support current operations of UC Davis is based upon a rate of 4.75 percent (stated in dollars per share). This rate is approved by the Regents of the University of California.
Endowment Funds
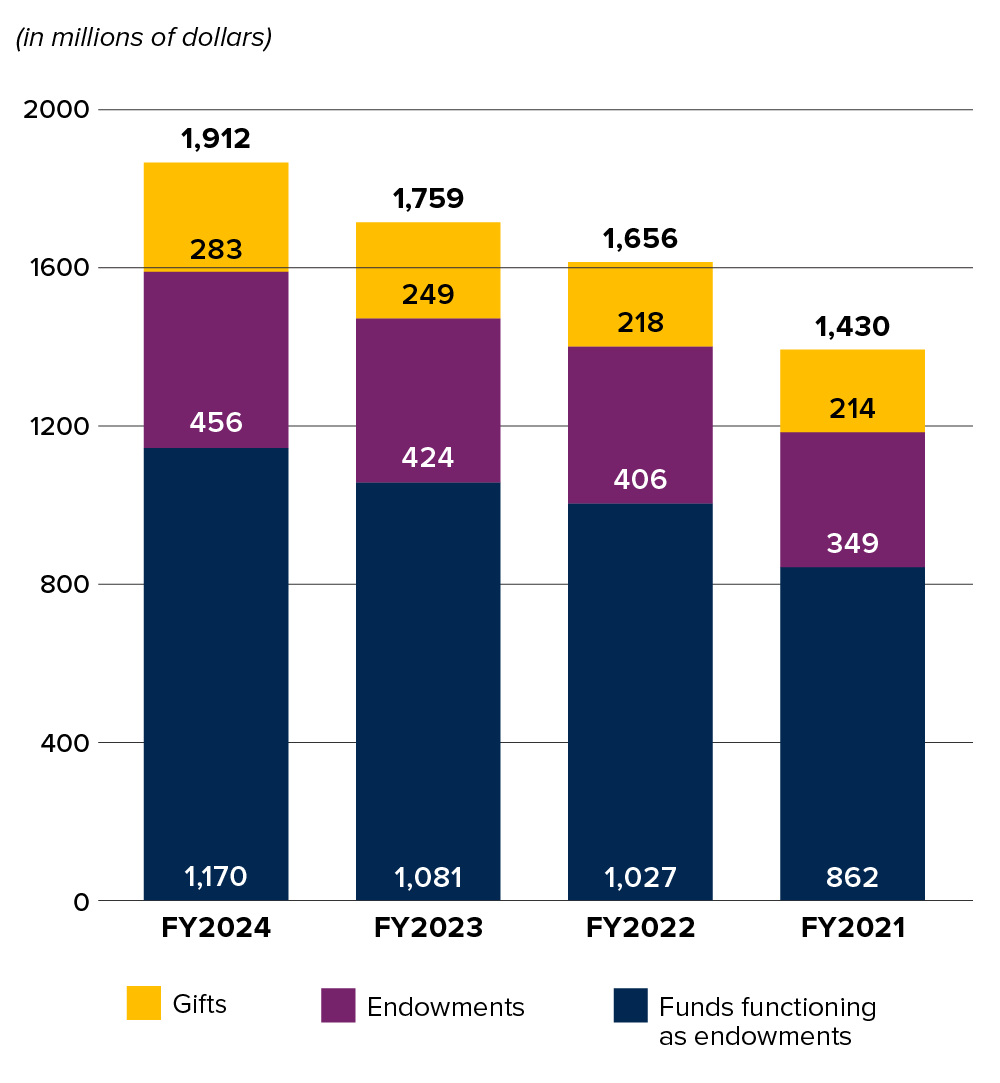
| (in millions of dollars) | FY 2024 | FY 2023 | FY 2022 | FY 2021 |
|---|---|---|---|---|
| Annuity and life income | 3 | 5 | 6 | 5 |
| Gifts | 283 | 249 | 218 | 214 |
| Endowments | 456 | 424 | 406 | 349 |
| Funds functioning as endowments | 1,170 | 1,081 | 1,027 | 862 |
| Endowments and gifts | 1,912 | 1,759 | 1,656 | 1,430 |