Parameter Series 1: How to Create a Dynamic Highlighter
How to Create a Dynamic Highlighter in Tableau
Intro
One way to distinguish your visualization is to add a level of interaction for the user. In this case, we are going to explore using a Parameter to dynamically highlight items in our visualization. For example, if you are giving a presentation about which cities have the highest sales, a Parameter will help you highlight the top several cities for emphasis.
Tutorial
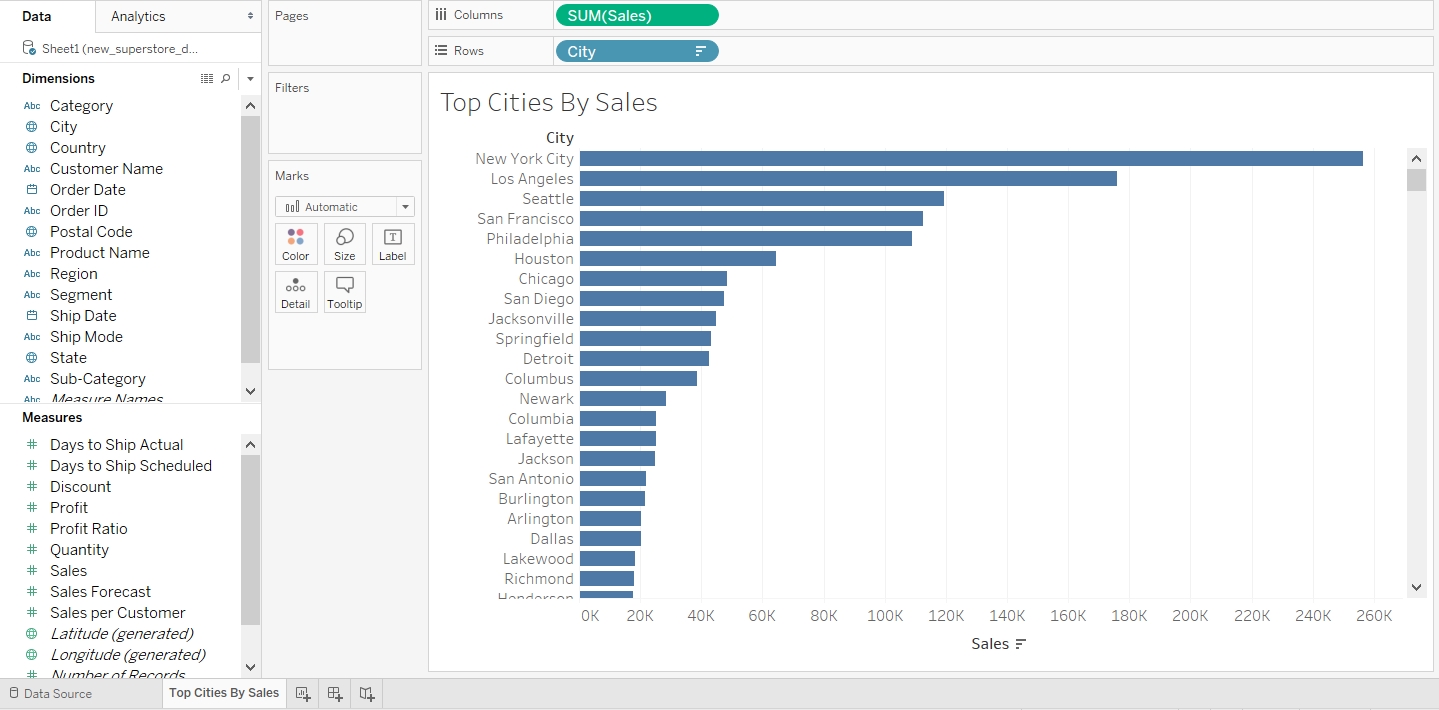
In our case, we want to show which cities rank the highest by sales and be able to dynamically highlight the top several spots.

Right click on the white space in the “Measures” section, and select “Create Parameter...”.

A window similar to this should pop up. The picture below is labeled by letters, and the instructions for each letter are listed below.

a) Name your new Parameter anything you want.
b) Change the data type to "Integer" instead of "Float", in order to make the data discrete instead of continuous.
c) Select “List” in the "Allowable values:" field.
d) Input the numbers 1-5 in the section that pops up. These will be the values you will later select to highlight the top 1-5 bars in the bar graph. If you want to be able to select more than 5 values, then input more.
Hit “OK” once you’re done.
With your Parameter created, right click its pill, and select “Show parameter Control” in order to bring the control into the sheet.

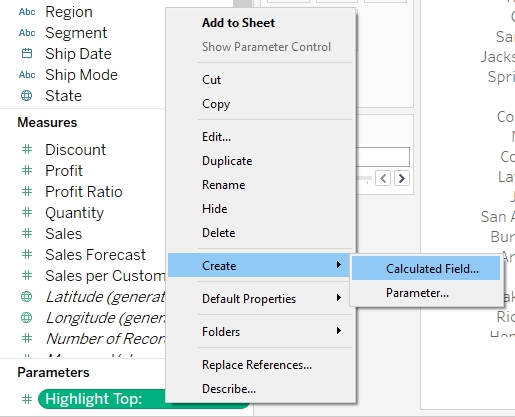
Now we want to create a Calculated Field that is able to tell whether each bar in the bar graph is below or above the value that is selected in the “Highlight Top:” parameter. Right click the “Highlight Top:” parameter and click “Create Calculated Field...”.

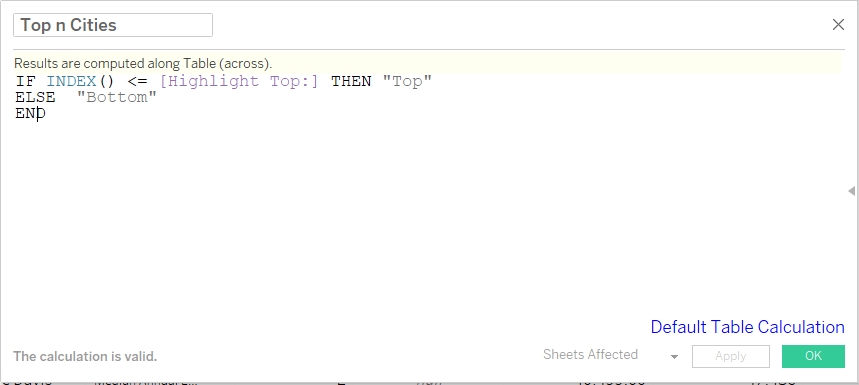
Name your Calculated Field anything you want, and copy and paste the following code into the body of the Calculated Field:
a) IF INDEX() <= [Highlight Top:] THEN “Top” ELSE “Bottom” END
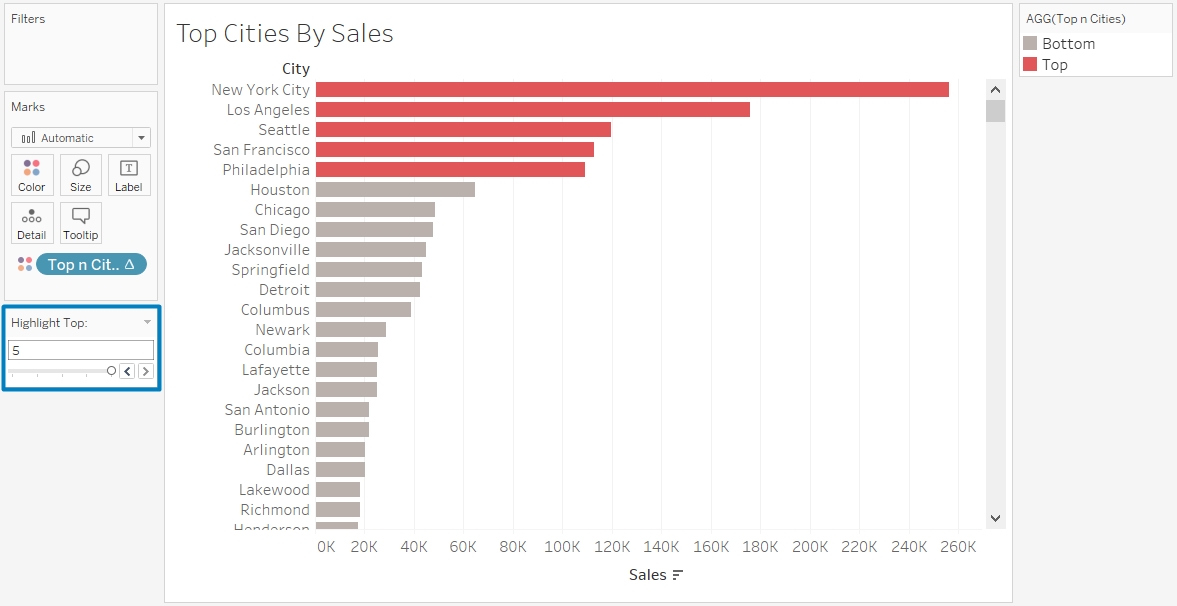
b) This is a simple if-then statement that checks to see if the index of the city shown in the sheet is less than or equal to the value currently selected in our parameter. Every city for which this is true gets grouped into a group called “Top”, and the rest get grouped into a group called “Bottom”.Now in order to make the Top and Bottom group show up on the sheet, drag and drop the “Top n Cities” calculated field to the Color Marks Tab. This should split the bars into two colors, and your Parameter should be fully functional. But we aren’t done quite yet...

Change the color split for better visibility, and you are all set. Now, selecting a number on the Parameter will highlight the same amount of bars on top of the sheet, like shown below.


That's it!
This is how you create a custom dynamic tool for highlighting parts of your workbook. If you found this tutorial interesting, make sure to check out some of our others at: https://businessintelligence.ucdavis.edu/tableau-tips-and-tricks. If you have any questions or comments, please feel free to contact the Business Intelligence Team at businessintelligence@ucdavis.edu.
Author: Maksym Monastyrskyy
